Testimonials
Services
Quick chat
Google Ads Budget Pacing Tracker (GSheet + Script)
1:1 Consultation
Mega Pack of Resources (UPDATED)
Priority DM
Discounting Strategy Using Product Bundling
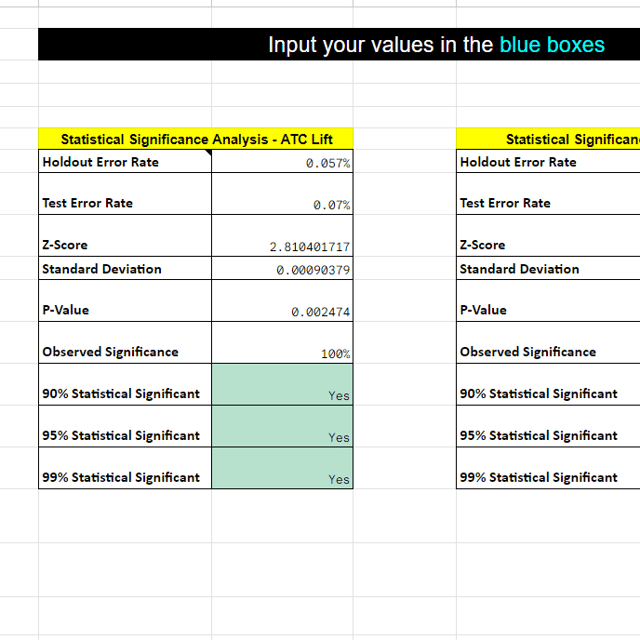
Incrementality Using Holdout Testing Template
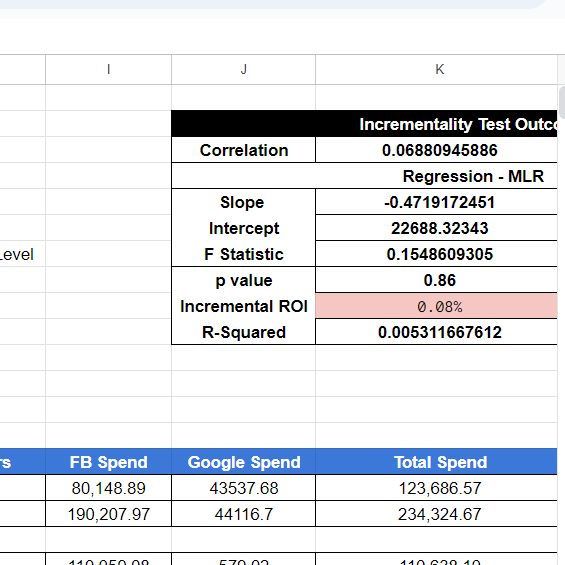
Priority DM - Advanced
Advanced Package
About me
Frequently asked questions
What is marketing mix modeling (MMM)?
Marketing mix modeling (MMM) is a statistical technique that estimates how much each marketing channel — search, social, TV, print, promotions and pricing — actually contributes to sales. It works on aggregate historical data instead of user-level tracking, so it keeps working even as cookies and device identifiers disappear. For many large advertisers in India, it has become the primary way to measure true marketing impact across both online and offline channels.
How does marketing mix modeling work?
A model treats sales as the outcome and weekly spend on each channel as inputs, alongside controls such as seasonality, price changes, promotions, distribution and macroeconomic factors. It then splits sales into a "base" (what you would sell with no marketing) and incremental contributions per channel, usually applying adstock and saturation curves to capture carryover and diminishing returns. The result is a channel-wise ROI you can use to reallocate budget with evidence instead of instinct.
How to do marketing mix modeling?
Gather 2–3 years of weekly data on sales, spend per channel, pricing, promotions and seasonality, then fit a regression-based model using tools like Robyn, Meridian, PyMC or LightweightMMM. Validate the model on a holdout period, sanity-check the channel contributions against business reality, and convert the results into budget scenarios. Most teams refresh the model every quarter and cross-check it with geo or holdout experiments.
What is a good marketing mix modeling example?
Picture an Indian D2C brand spending on Meta, Google, Amazon ads and quick-commerce placements, with rising spend but flat revenue. An MMM might show that branded search was largely harvesting demand created by social, so last-click numbers overstated search and understated social. Reallocating budget toward channels with genuine incremental impact — and timing it around festive peaks — lets the brand grow sales without increasing total spend.
Do I need a marketing mix modeling course to learn MMM?
A structured marketing mix modeling course helps you avoid beginner mistakes, but many practitioners are self-taught. The documentation for open-source tools like Robyn, Meridian and PyMC is genuinely educational, and there is no single definitive marketing mix modeling book — practitioner blogs, case studies and hands-on projects with dummy data usually teach more than most textbooks. The fastest way to learn is building one full model on a real dataset end to end.
What is incrementality testing in marketing?
Incrementality testing in marketing measures the conversions an ad campaign actually caused, rather than the conversions that merely happened while the ads were running. An exposed group is compared with a control group that sees no advertising — through a holdout, geo split or platform lift study — and the difference in results is your incremental lift. This matters because platforms routinely claim conversions from people who would have purchased anyway.
How to do incrementality testing?
Define the KPI you want to prove (usually incremental conversions or revenue), then pick one of the standard incrementality testing methods: a geo experiment where media is paused in matched regions, an audience holdout where a random slice stays unexposed, or a platform-run conversion lift study. Run the test long enough to cover your average purchase cycle, calculate lift as the difference between test and control, and use the result to guide budget decisions.
Incrementality testing vs A/B testing — what's the difference?
An A/B test compares two variants — two landing pages, two creatives — shown to audiences that all receive some advertising, so it optimises performance within a channel. Incrementality testing compares people who saw ads with people who saw none, answering a bigger question: does this channel or campaign generate sales at all? Use A/B tests to improve what is already running, and incrementality tests to decide where the money should go.
How do I run incrementality testing in Google Ads?
Because Google Ads does not allow clean user-level holdouts, the practical route is a geo experiment: match similar regions, keep spend running in the control group and pause or reduce it in the test group, then compare the difference in sales. Google's own lift studies cover some formats, and geo-based tests are especially valuable for Performance Max, where limited transparency makes it hard to tell whether spend adds new sales or simply absorbs branded-search demand.
How does incrementality testing in Meta work?
Meta's standard approach is a conversion lift experiment: Meta randomly splits your target audience into a test group that sees the ads and a holdout group that does not, then reports the difference in purchases, leads or app events. You can also run geo holdouts by switching Meta spend off in selected regions. The control group must stay completely unexposed — even small leakage of ads into the holdout makes the lift estimate unreliable.
Which incrementality testing tools are worth using?
For geo experiments, the most widely used open-source options are GeoLift, CausalImpact and CausalPy, all free if you are comfortable with Python or R. Platform-native lift studies cover the walled gardens, while simple spreadsheet-based holdout templates work well for smaller budgets that do not justify a full modeling setup. Mature teams usually combine one of these with an MMM so experimental results can validate what the model claims.
What are the main marketing attribution models?
The standard set includes first-click, last-click, linear, time-decay and position-based (U-shaped) models, along with data-driven attribution, which distributes credit algorithmically across converting paths. Last-click remains the default in most ad platforms, but it over-credits bottom-funnel channels like brand search, while multi-touch models spread credit across the journey. No model proves causality on its own, which is why teams pair attribution with incrementality testing or MMM.
How to track marketing attribution across multiple channels?
The foundation is disciplined UTM tagging on every campaign, consistent conversion tracking in GA4, and server-side or API-based conversion feeds so platform-reported numbers stay comparable. For lead-generation businesses, capture source and campaign data into your CRM so every lead and deal can be traced back to its origin. Reporting everything from one warehouse like BigQuery, visualised through Looker Studio or Power BI, keeps all channels on a single source of truth.
What are the best marketing attribution tools?
For most small and mid-sized Indian businesses, GA4 combined with ad-platform attribution and a CRM is enough to start. Teams needing user-level, cross-channel views move to dedicated multi-touch attribution or customer data platforms, while advanced setups push raw data into BigQuery and build attribution reporting in Looker Studio or Power BI. Whichever stack you choose, treat independent tracking as the source of truth, since every ad platform overstates its own contribution.
How do I set up marketing attribution in Zoho CRM?
Capture UTM parameters through your website forms into dedicated lead fields in Zoho — source, medium and campaign at minimum — so every lead carries its origin. Use workflow rules to preserve first-touch values and update last-touch values as the lead engages, then connect Zoho Analytics to report revenue by source and campaign. That turns a simple lead count into a source-wise view of which channels actually generate pipeline.