Testimonials
Services


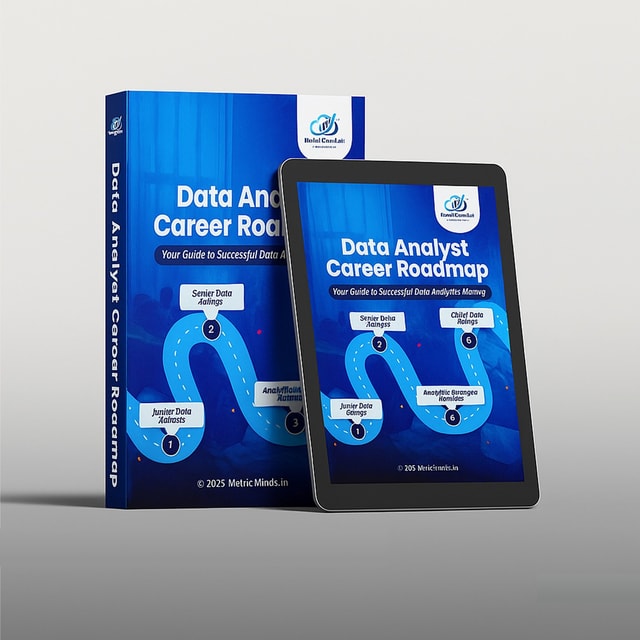
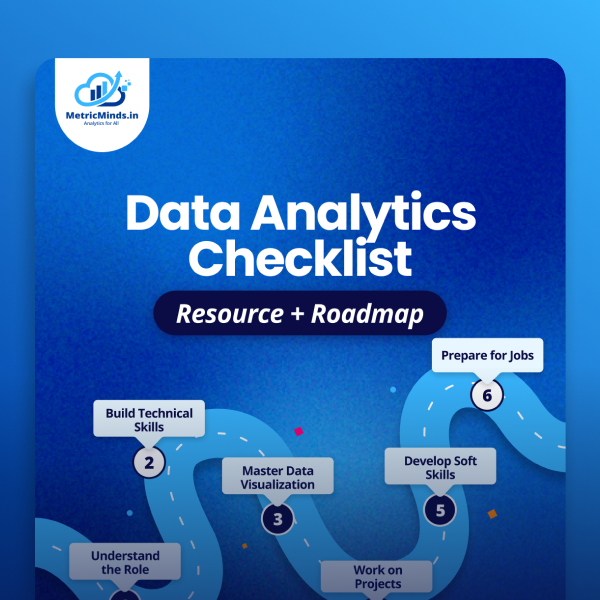
Data Analysts Career Roadmap
Collection of My Posts
Resume Review Session
Build a Job-Winning DA Portfolio With Me
Personalized Expert Consultation: Ask Me Anything
Discovery Call (Context Data Analytics Mentorship)
DAX Function in Power BI
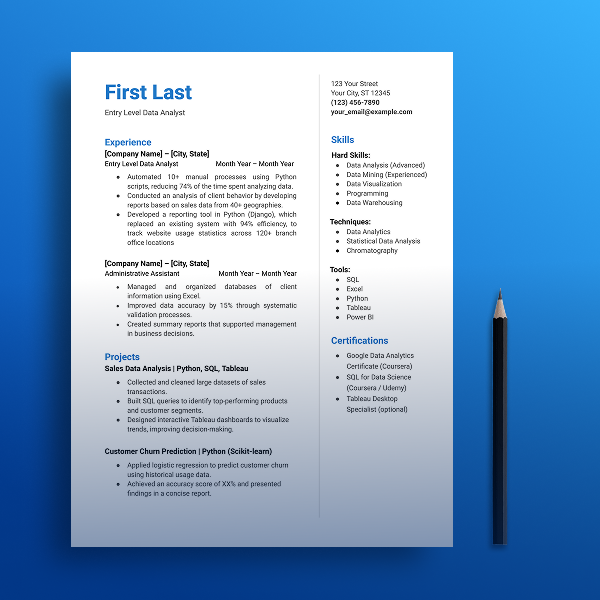
Understanding the Data Analyst Role

Business & Visual Analysis Techniques - Apr-2026
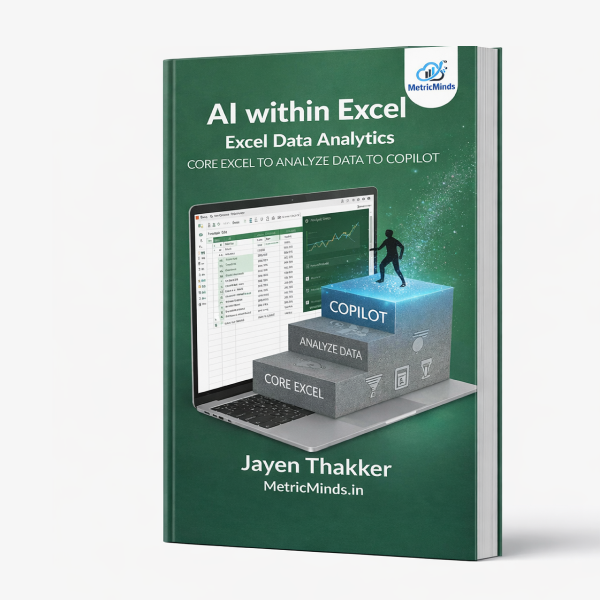
Data Analytics Projects Guide
Interview Questions - Help you prep for interviews
Data Analytics Doubts Clearing - Ask Me Anything
Build a Job-Winning DA Portfolio With Me
Career guidance
About me
Frequently asked questions
How to start a data analytics career in India?
Start by building three core skills: Excel, SQL, and one visualization tool like Power BI or Tableau, along with basic statistics. You don't need an expensive degree to enter this field — a good structured course, consistent practice, and 2–3 hands-on projects using real-world datasets are enough to make you employable. In India, freshers usually get their first break through internships, service-based companies, analyst roles in BFSI and e-commerce, or by moving into an analytics role within their current organisation. Expect around 4–6 months of focused preparation before you can apply confidently.
How to switch to a data analytics career from a non-technical background?
Begin with the skills you already use daily — Excel is usually the easiest entry point for non-technical professionals. From there, learn SQL, then Power BI or Tableau, and apply them to problems from your own industry, because domain knowledge is a genuine advantage employers value. Roles like business analyst or reporting analyst are often the smoothest bridge into analytics. People in India successfully switch from sales, operations, finance, HR, and even teaching backgrounds by building a small portfolio and targeting hybrid roles that combine their old domain with new analytics skills.
What is the data analyst career path in India?
Most people enter as a junior or trainee data analyst, handling dashboards, reports, and data cleaning. Within 2–3 years, you typically grow into a data analyst or senior analyst role, owning business insights and stakeholder communication. After 5–7 years, the path branches into analytics manager, lead data analyst, or specialist tracks like product analytics and BI consulting, eventually leading to head of analytics or director-level roles. Some analysts also pivot into data science or analytics engineering. Timelines vary with skills, company size, and how quickly you move from tool-based work to business impact.
What are the data analytics career options in India?
Popular roles include data analyst, business analyst, BI developer, product analyst, operations analyst, and analytics consultant. With India's BFSI, e-commerce, healthcare, IT services, and startup ecosystem hiring heavily, you can also specialise in areas like marketing analytics, financial analytics, or supply chain analytics. Adjacent paths such as data engineering and data science open up once you add Python and advanced SQL. Freshers usually start with reporting-heavy roles, while experienced professionals from banking, retail, or insurance often enter through domain-specific analyst positions that reward business context.
What does data analytics career growth look like in India?
Growth is strong because nearly every industry now runs on data-driven decisions. Early-career analysts who master SQL, Power BI or Tableau, and storytelling with data see the fastest salary jumps, especially when they move from pure reporting to roles that influence business decisions. Mid-career growth comes from leading projects, mentoring juniors, and owning KPIs, which leads to analytics manager and leadership roles. Freelancing and consulting are also viable later. The key is to keep upgrading beyond tools — business domain knowledge and communication skills separate high-growth analysts from those who plateau.
How to crack a data analyst interview as a fresher?
Most fresher interviews in India test four things: SQL, Excel, a BI tool like Power BI, and your understanding of your own projects. Prepare to write SQL queries on joins, GROUP BY, and window functions, explain pivot tables and lookups, and walk through every dashboard or project on your resume confidently. Add basic statistics and a structured approach to scenario questions like "sales dropped 20% — how would you investigate it?" Around 4–6 weeks of focused data analyst interview preparation, including mock interviews and a portfolio link on your resume, puts you ahead of most candidates.
What are the most common data analyst interview questions and answers for freshers?
Expect questions in four buckets. SQL: difference between WHERE and HAVING, types of joins, finding the second-highest salary, GROUP BY usage. Excel: VLOOKUP/XLOOKUP, pivot tables, data cleaning. Power BI or Tableau: measures vs calculated columns, how you built your project dashboards. Statistics and scenarios: mean vs median, outliers, correlation, and business cases like investigating a drop in sales. Interviewers also deep-dive into your resume projects, so prepare each one as a short story — the problem, the steps you took, the tools you used, and the business impact of your findings.
What is Power BI DAX used for?
DAX (Data Analysis Expressions) is the formula language of Power BI, used to create calculations that simple drag-and-drop visuals cannot handle. You use it to build measures and calculated columns for things like total sales, profit margins, year-over-year growth, month-to-date and year-to-date figures, running totals, and custom KPIs. It is also used for row-level security, where DAX expressions control what data each user can see. In short, whenever a business question needs custom logic — filtering, time comparisons, or conditional results — DAX is what makes it possible in Power BI.
How to learn Power BI DAX from scratch?
Start with simple aggregations like SUM, AVERAGE, and COUNTROWS before touching advanced functions. Next, understand evaluation context — row context and filter context — because that single concept explains most DAX confusion. Then learn CALCULATE properly, since almost every real-world measure depends on it. Practise by recreating business calculations such as profit margin, YoY growth, and running totals on sample datasets instead of memorising syntax. A structured sequence — basics, context, CALCULATE, time intelligence, then iterators like SUMX — takes most learners from zero to job-ready DAX within a few weeks of consistent practice.
Which Power BI DAX functions should beginners learn first?
Begin with the aggregators — SUM, AVERAGE, MIN, MAX, and COUNTROWS — then move to CALCULATE, which modifies filter context and powers most real-world measures. After that, learn FILTER, ALL, and RELATED to control and navigate data relationships, and DIVIDE for calculations that safely handle divide-by-zero errors. Add iterators like SUMX once you're comfortable, and finish with time intelligence functions such as SAMEPERIODLASTYEAR, TOTALYTD, and DATEADD for growth and period comparisons. Mastering roughly 12–15 functions covers the majority of day-to-day Power BI reporting and interview scenarios.
Where can I find real datasets for Power BI DAX practice?
Good options include Microsoft's official sample datasets such as AdventureWorks and Contoso, Kaggle, India's open government data portal, and global public datasets from world bank portals. Pick something you relate to — e-commerce sales, IPL cricket, stock prices, or health data — because analysing familiar business problems makes practice far more effective. Don't just load the data; build measures for revenue, growth percentage, rankings, and moving averages, then recreate a small dashboard. Practising on realistic business questions rather than toy examples is what makes your skills genuinely interview-ready.
What are the most asked Power BI DAX interview questions?
The classics are: difference between a measure and a calculated column; filter context vs row context; what CALCULATE does; difference between SUM and SUMX; and how ALL, ALLEXCEPT, and REMOVEFILTERS work. Time intelligence is another favourite — expect questions on calculating YoY growth, YTD sales, or moving averages. Interviewers often ask you to write a measure live, such as profit margin or a running total, and to explain RELATED vs LOOKUPVALUE. Prepare short, practical explanations with a small example for each, since interviewers test whether you can apply DAX, not just define it.
How do I build a data analyst portfolio with no experience?
Create 2–3 end-to-end projects using public datasets — for example, an e-commerce sales dashboard, an HR attrition analysis, or a financial KPI report. Each project should show the full workflow: SQL or Excel for cleaning, Power BI or Tableau for the dashboard, and a short written summary of the business insights. Publish your work on GitHub and share interactive dashboards through Tableau Public or the Power BI service so recruiters can view them directly. One project based on an Indian business context — like UPI adoption or retail sales — instantly makes your portfolio more relatable. Two well-explained projects beat five half-finished ones.
How do I write a resume for a data analyst fresher job?
Keep it to one page, ATS-friendly, with a clean skills section listing SQL, Excel, Power BI or Tableau, and Python if you know it. Instead of listing responsibilities, describe projects and internships with numbers — "automated weekly reporting in Excel, saving 5 hours per week" or "built a Power BI dashboard tracking 10 KPIs". Mirror keywords from the job description, since most Indian companies shortlist through ATS filters. Skip photos, personal details, and long career-objective paragraphs. Link your portfolio or GitHub at the top, and get the resume reviewed by an experienced analyst before applying.
Do I need a mentor to become a data analyst?
It's not mandatory, but the right mentor can save you months of confusion. Most self-learners struggle with the same issues: too many courses, no clear roadmap, projects that don't impress recruiters, and no feedback on where they're going wrong. A mentor who has actually worked in analytics helps you sequence skills correctly, choose projects that match what companies in India actually ask for, and prepare for interviews with honest feedback. If you can't find one, even occasional check-ins with industry professionals on LinkedIn or communities are far better than learning in complete isolation.