Testimonials
Services
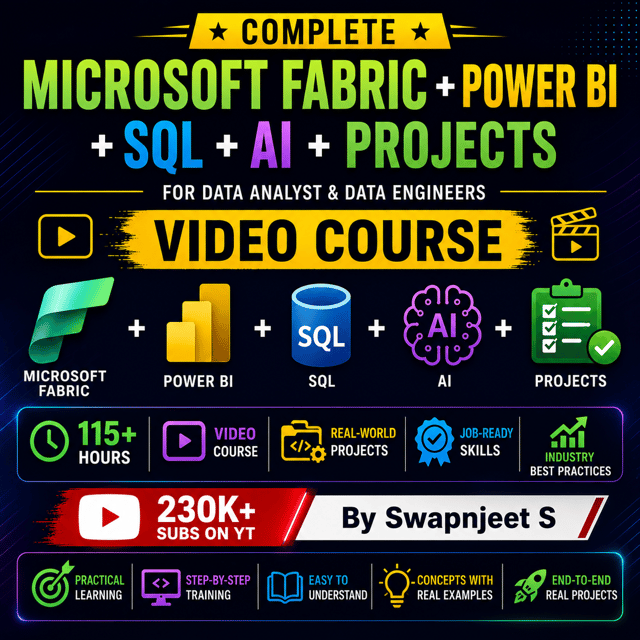
Microsoft Fabric + Power BI +SQL + Project Course
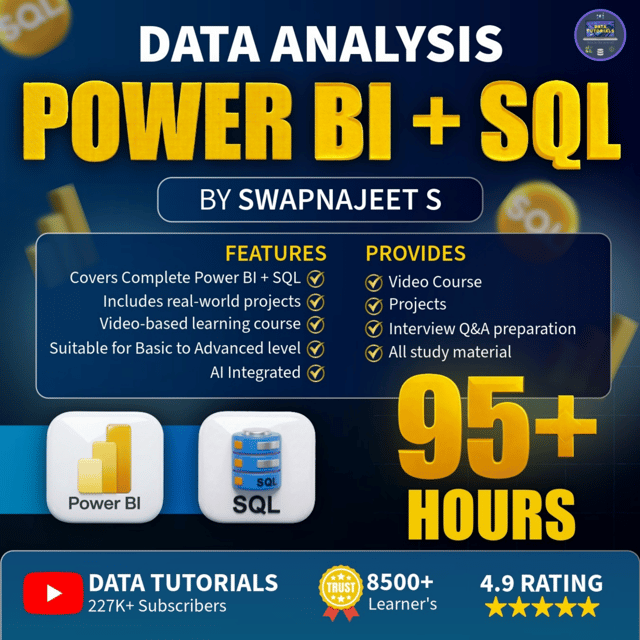
SQL + Power BI + AI + PowerBI Projects + Materials


22 Power BI Projects - Video Course

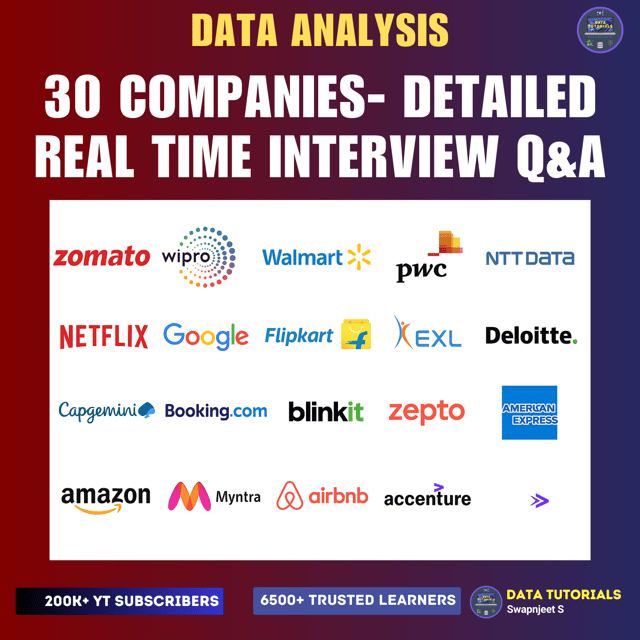
30 Companies- Detailed Real Time Interview Q&A
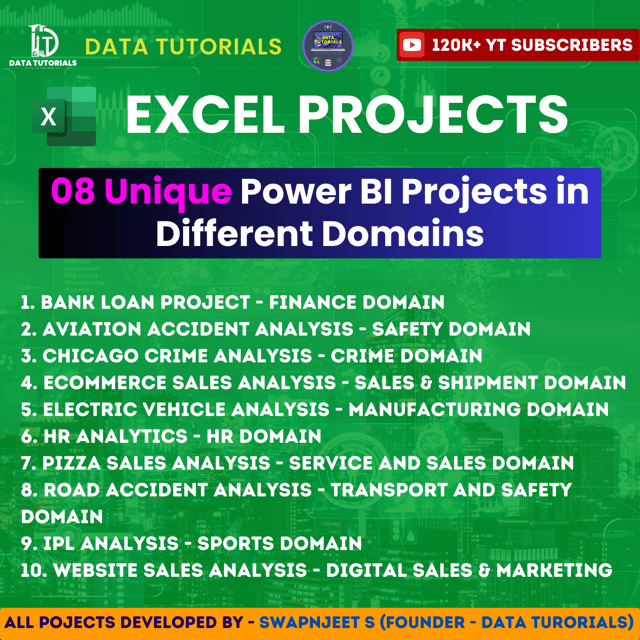
Excel Projects -10 Unique Projects (Without Video)

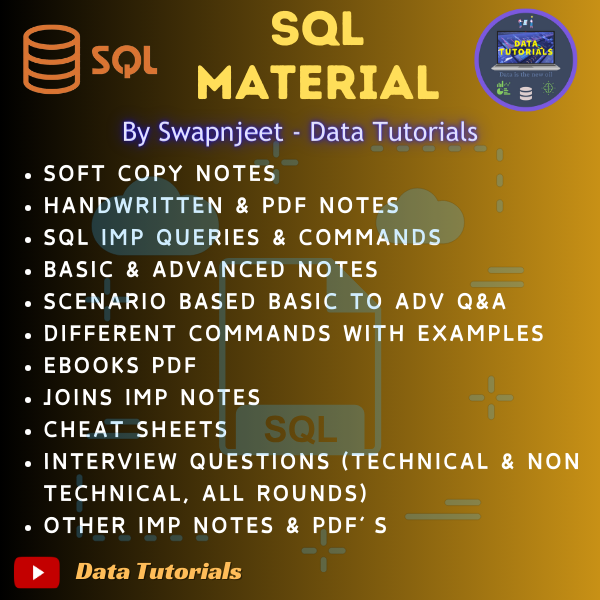
Power BI Material - 2026 Edition
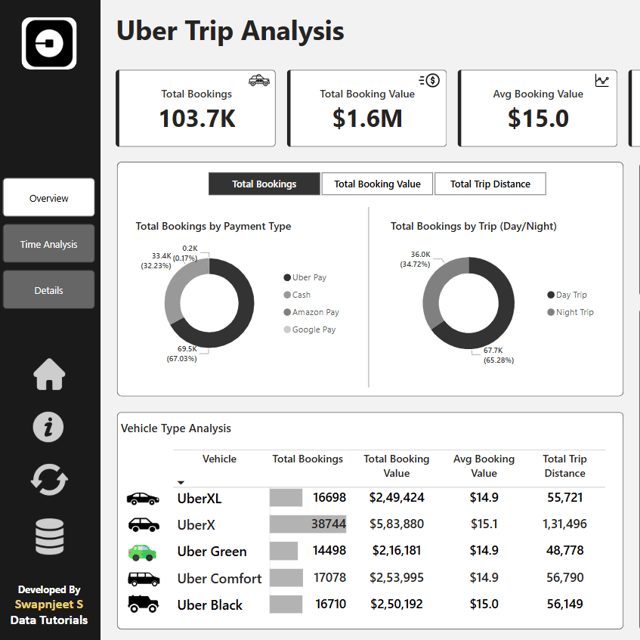
Uber Analysis - Power BI Project
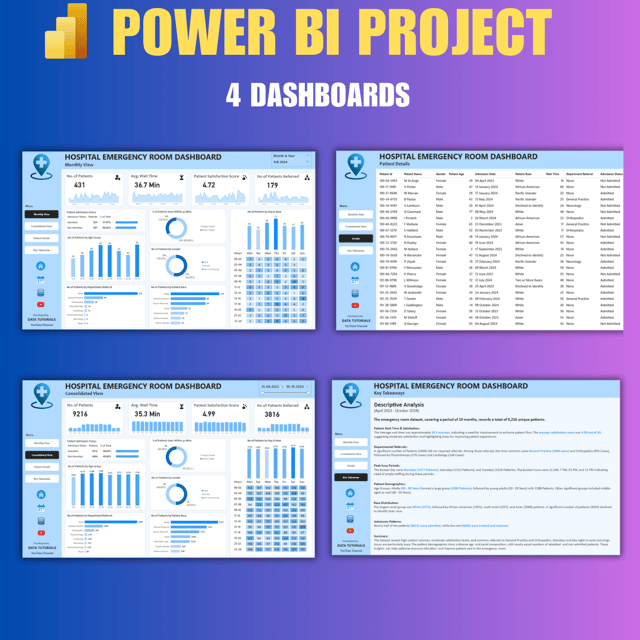
Interview preparation & Tips (Tableau)
Mock Interview (Data Analyst - Tableau)
Mock Interview (Data Analyst - Power BI)
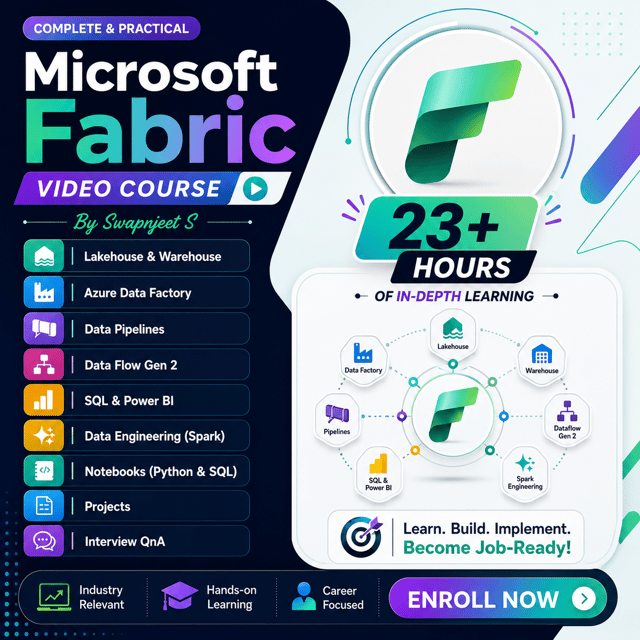
Micrososft Fabric Complete Course (End to End)
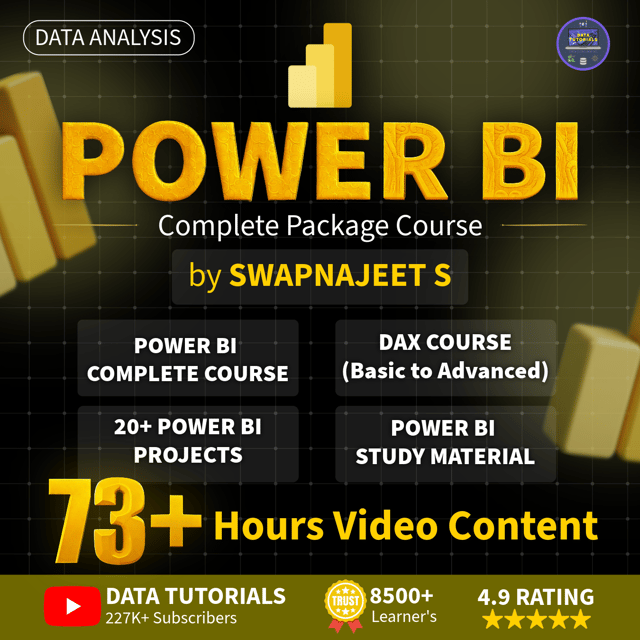
Power BI + AI + DAX + 21 Projects Video Course
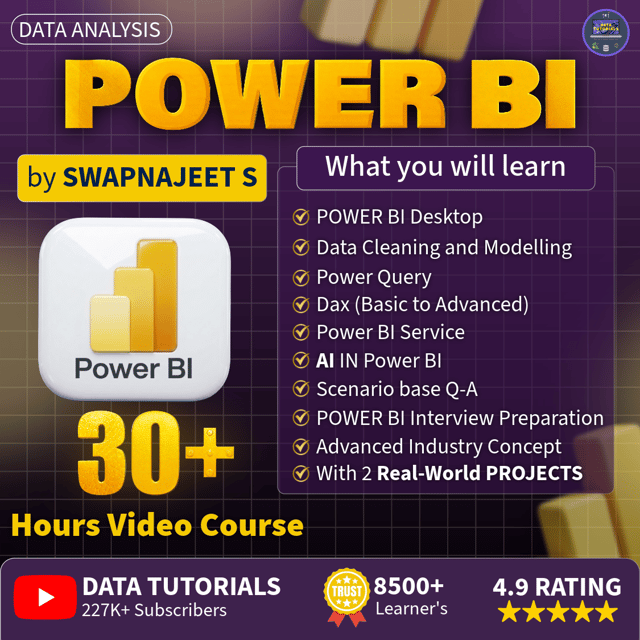
Power BI Complete Course with AI (Beginner to Pro)
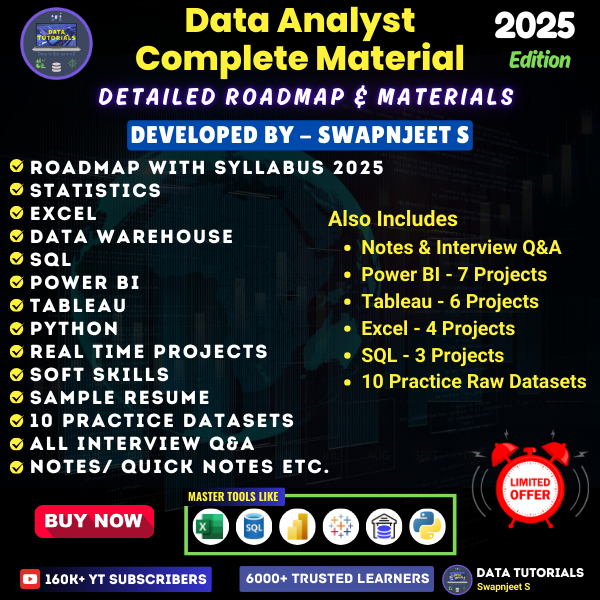
Data Analyst Complete Material - 2026 Edition

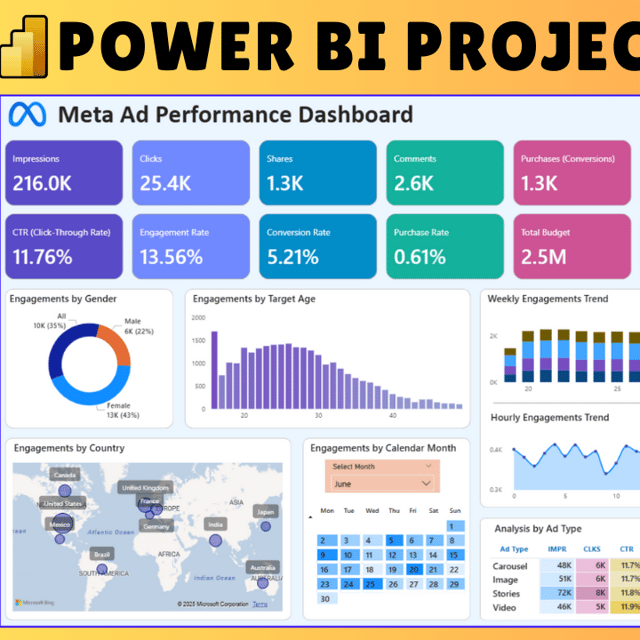
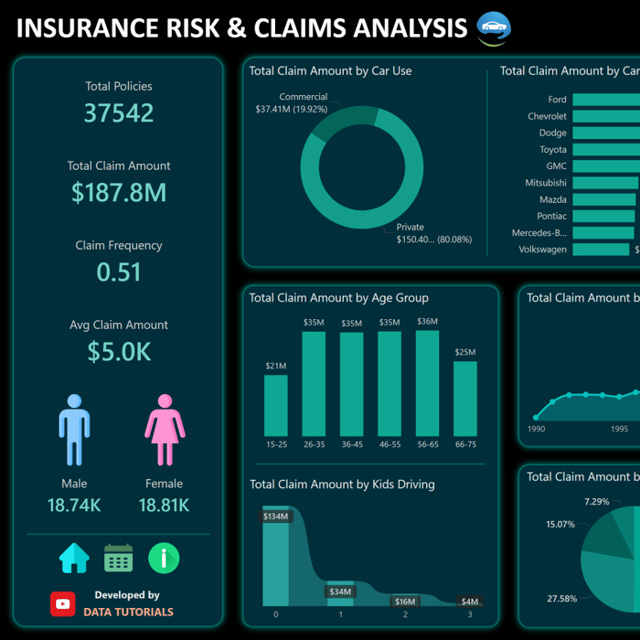
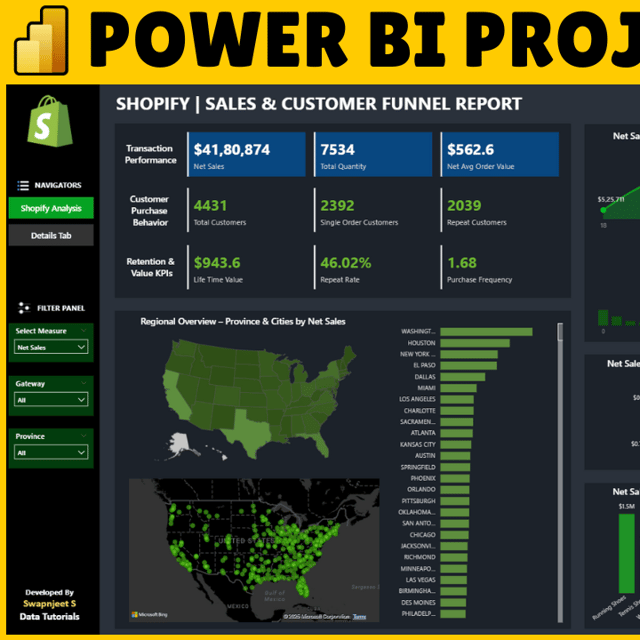
Shopify Sales Analysis - Power BI
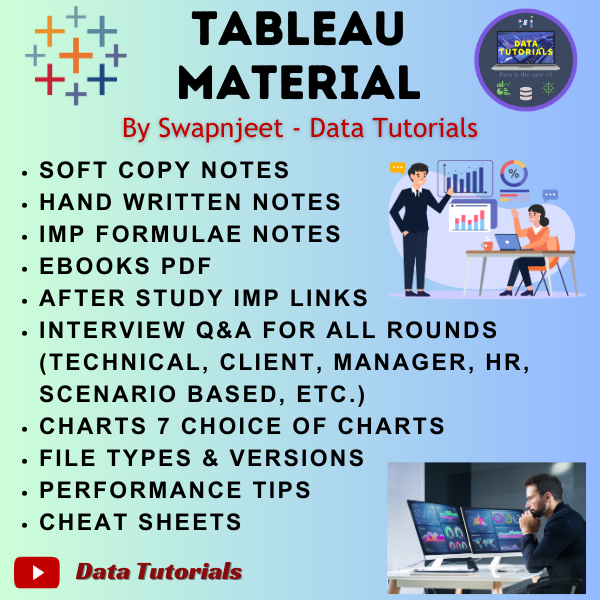
Tableau Material - Edition 2026

Spotify Analysis - Power BI Project
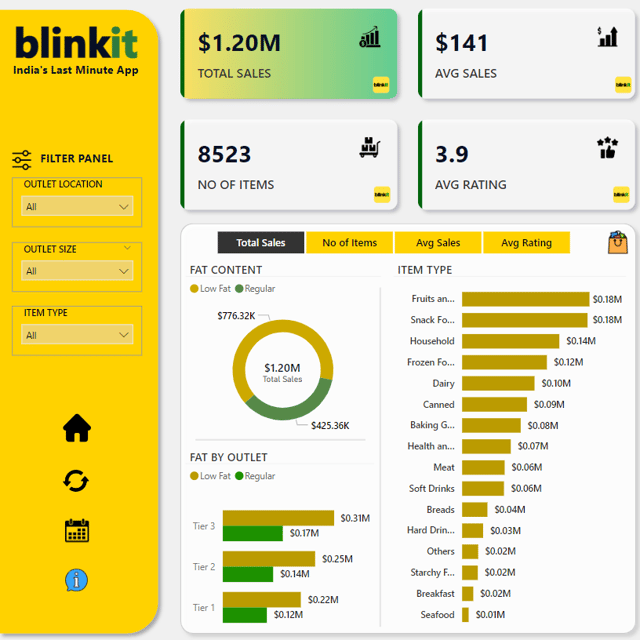
Blinkit Project Dashboard & Files
Career guidance (Data Analyst)
Interview preparation & Tips (Power BI)
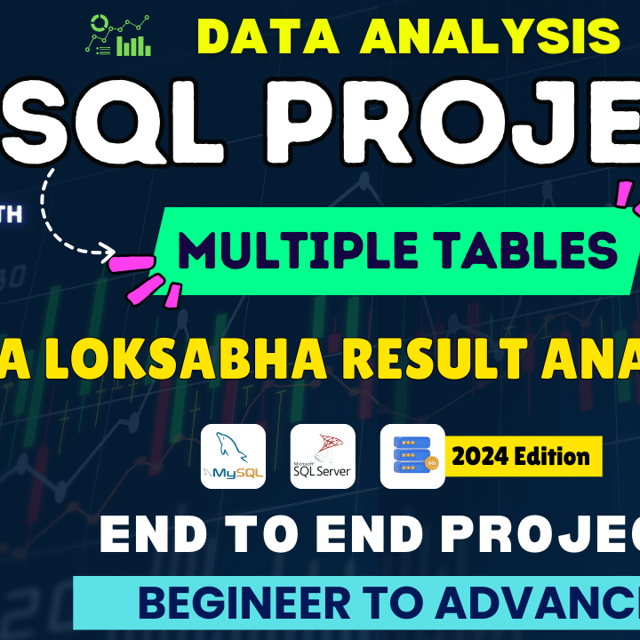
India Election Data & Query Doc Download (FREE)
About me
Frequently asked questions
What is Power BI used for?
Power BI is used to connect to different data sources, clean and model data, and build interactive dashboards and reports for decision-making. Data analysts commonly use it for sales analysis, financial reporting, and KPI tracking, and it pairs closely with Excel and SQL in most analytics roles.
What are Power BI and Tableau, and which one should I learn first?
Power BI and Tableau are both business intelligence tools used to turn raw data into dashboards and visual reports. Power BI is more affordable, integrates tightly with Excel and other Microsoft tools, and is widely used across Indian companies, while Tableau is known for deep visual exploration. Beginners targeting analyst jobs in India usually start with Power BI and add Tableau later.
How to create a Power BI dashboard step by step?
Install Power BI Desktop, import your dataset from Excel, CSV, or a SQL database, and clean the data using Power Query. Next, build relationships between tables, create measures with DAX, and add visuals like cards, charts, and slicers. Once the report is ready, publish it to the cloud service to share it with others.
What are the best practices for Power BI dashboard design?
Good Power BI dashboard design starts with a clear business question, a clean layout, and a limited colour palette. Place the most important KPIs at the top, use consistent formatting, avoid overcrowding the page with visuals, and add slicers or drill-throughs so users can explore the data. Always design for the end user, not just for good-looking charts.
How to learn Power BI on YouTube for free?
YouTube is one of the best free ways to learn Power BI, especially for beginners in India. Look for full beginner-to-pro playlists instead of random videos, build the same dashboard along with the video, and then recreate it using a different dataset. Combining videos with hands-on practice helps you build a portfolio, not just watch time.
What is a Power BI course and what should it cover?
A Power BI course teaches you the tool end to end — connecting to data sources, cleaning data with Power Query, data modelling, writing DAX formulas, and designing dashboards. A good course should include real, industry-style projects such as sales, finance, or retail dashboards, because recruiters in India shortlist candidates mainly on hands-on project work rather than theory.
What are the most common Power BI interview questions?
Power BI interviews usually cover DAX measures vs calculated columns, the difference between Power BI Desktop and the cloud service, data modelling concepts like star schema, filter and row context, Power Query transformations, and scenarios such as handling large datasets or slow reports. Interviewers also ask you to walk through a dashboard you have built, so keep at least two strong projects ready to explain.
What is the difference between Power BI Desktop and Power BI Service?
Power BI Desktop is the free Windows application where you build reports, while Power BI Service is the cloud platform used to publish, share, and collaborate on them. The Power BI Desktop download is available at no cost from Microsoft's website, whereas full sharing and collaboration in Power BI Service typically requires a paid licence. Most analysts do their actual work in Desktop and use the Service for distribution.
How to use SQL for data analysis as a beginner?
Analysts use SQL to pull exactly the data they need from a database — filtering rows with WHERE, joining multiple tables, and summarising results with GROUP BY and aggregate functions. In practice, SQL is used to prepare and validate data, which is then loaded into Excel or Power BI for visualisation. Learning SELECT, JOINs, and GROUP BY first covers most day-to-day analyst tasks.
How do I choose the right SQL for data analysis course?
Pick a SQL for data analysis course that is hands-on, built around real datasets, and covers joins, aggregations, subqueries, and window functions instead of only basic syntax. Check that it includes practice exercises and at least one project you can add to your resume, and read recent learner reviews before paying. Free resources are fine to start, but a structured course with projects makes you job-ready faster.
What is a data analyst project?
A data analyst project is a hands-on exercise where you take a raw dataset, clean and analyse it, and present the insights through a dashboard or report. A typical project moves from data collection and cleaning using Excel, SQL, or Python, to visualisation in Power BI or Tableau, and ends with business recommendations. It shows recruiters that you can apply your skills, not just list them.
How to get data analyst projects without any work experience?
You do not need a job to get data analyst projects — start with free public datasets from platforms like Kaggle or government data portals and build end-to-end projects around them. Recreate real business scenarios such as sales analysis, HR attrition, or e-commerce performance, document your work on GitHub and LinkedIn, and add the best two or three to your resume. Freshers can also gain real experience through internships or by helping small businesses with their data.
What are some good data analyst project ideas for freshers?
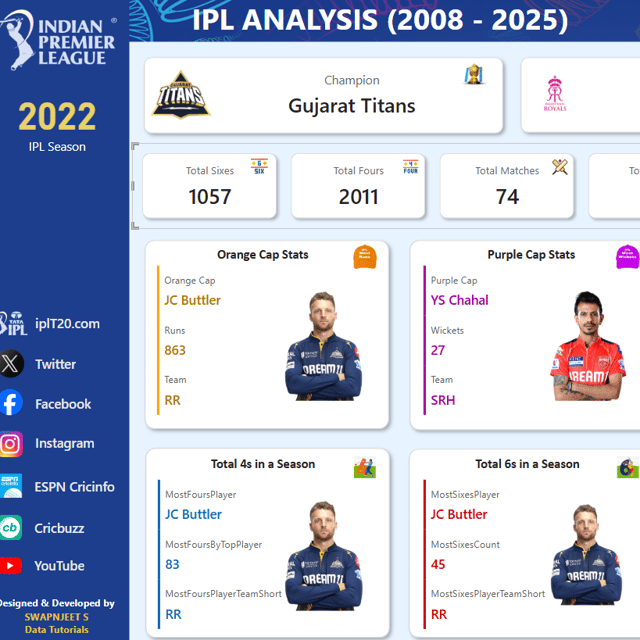
Strong data analyst projects for freshers include sales and revenue analysis, customer segmentation, HR attrition analysis, quick-commerce retail dashboards, IPL match analysis, and finance domain projects like expense or insurance claims analysis. Choose project ideas that use SQL for data preparation and Power BI or Tableau for dashboards, since this mirrors how analytics teams actually work.
What are the best data analyst projects for a resume?
The best data analyst projects for a resume are three to five end-to-end projects that combine SQL, Excel, and Power BI or Tableau across different domains such as sales, healthcare, finance, or retail. Each project should demonstrate data cleaning, analysis, and a decision-ready dashboard with clear business insights, hosted on GitHub or a portfolio site. Domain variety matters more than the number of projects.
Where can I find data analyst projects on GitHub?
Search GitHub for terms like "data analysis", "Power BI dashboard", or "SQL portfolio" and you will find many repositories containing datasets, query files, and dashboard files. Use them to understand proper project structure — problem statement, data cleaning steps, and insights — but do not upload someone else's work as your own, because original data analyst projects for a portfolio carry far more weight with recruiters than copied repositories.