Testimonials
Services
Vendor Performance Analysis Data
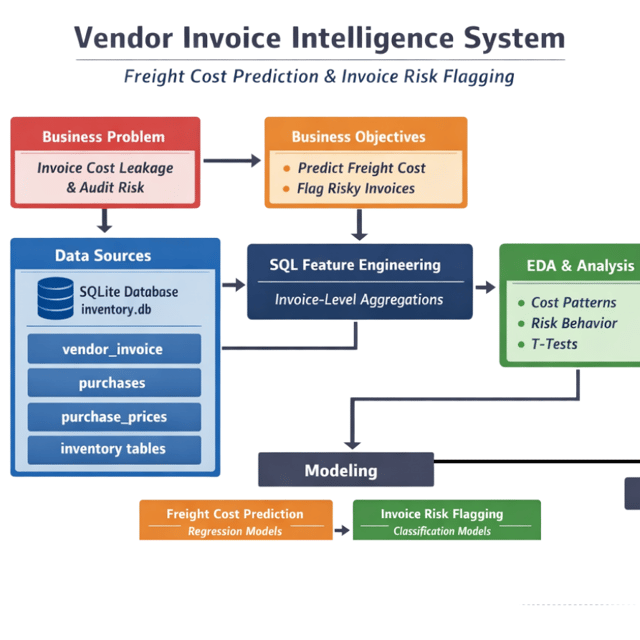
Invoice Intelligence Data
Exploratory Data Analysis Using Python
Supply Chain Analysis Project
Machine Learning eBook + Practice Code Bundle
Complete Roadmap for Data Analyst
Stock Forecasting Application
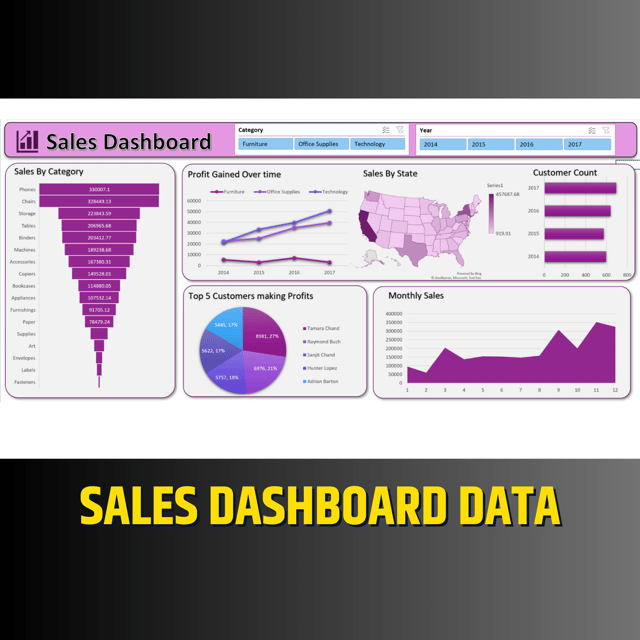
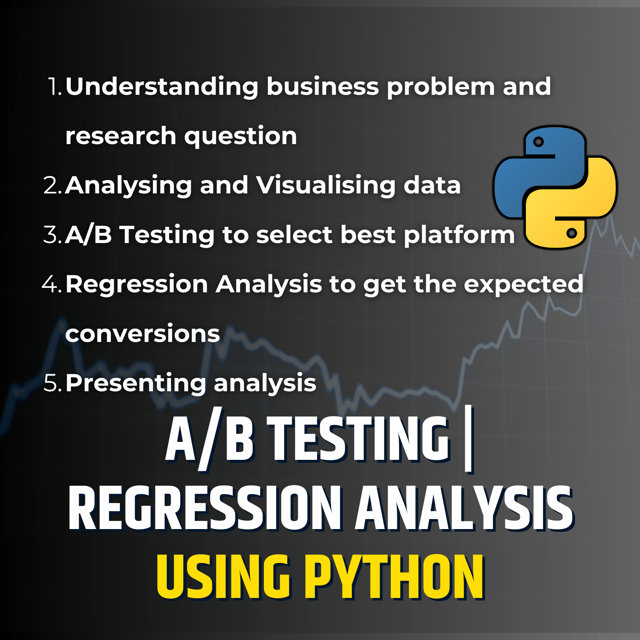
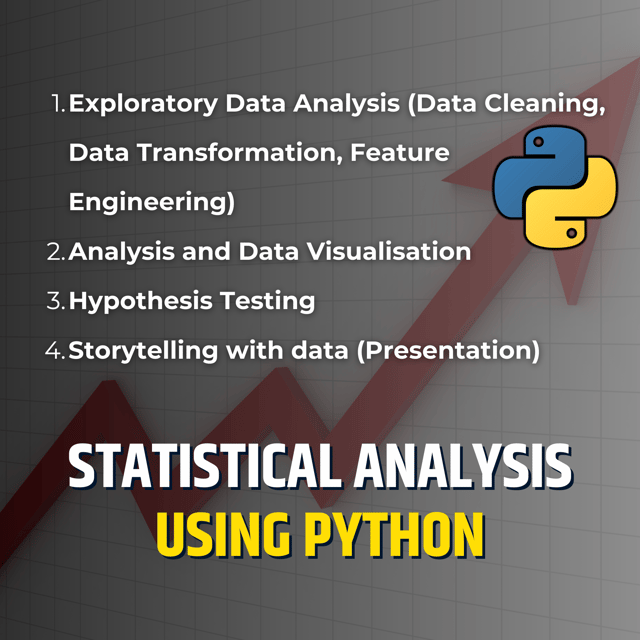
Maximizing Revenue for Drivers using Python
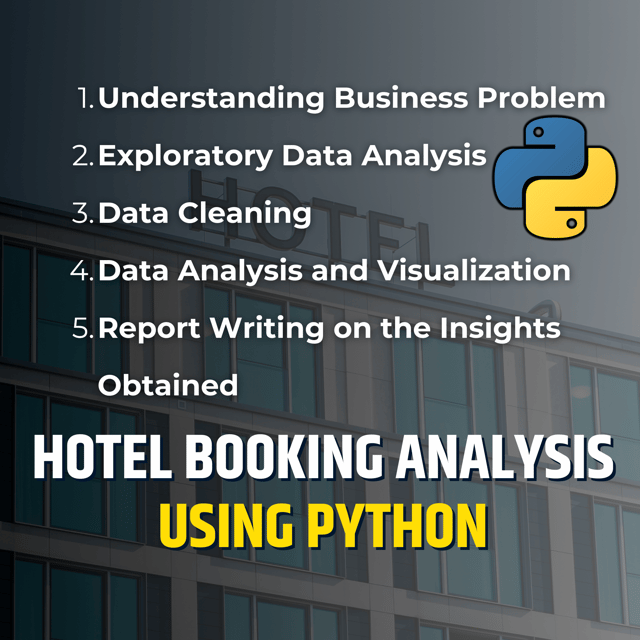
Hotel Booking Analysis using Python
LinkedIn Profile Review
Resume Review
Complete Descriptive Statistics Notes
IOT Notes (Handwritten)
Prompt Engineering Crash Course – Notes
Generative AI for Data Analyst
5 Premium Data Analyst eBooks Bundle

Complete Job Preparation and Interview Guide
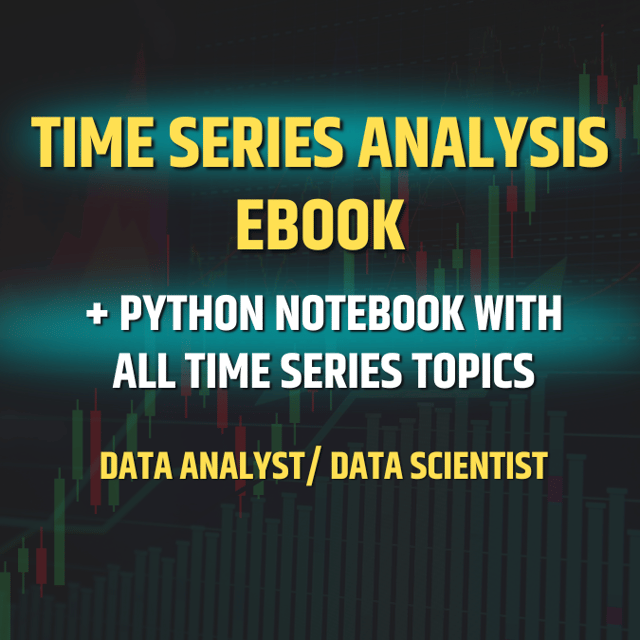
Time Series Analysis eBook + Helping Code Notebook
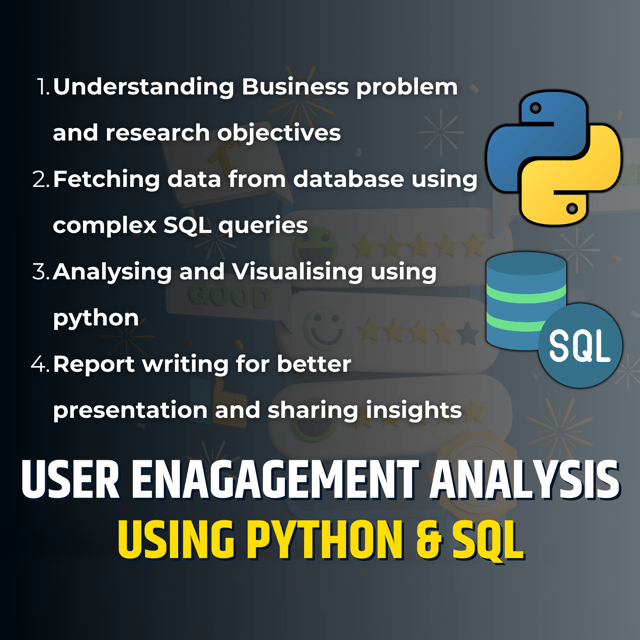
User Engagement Analysis using Python and SQL
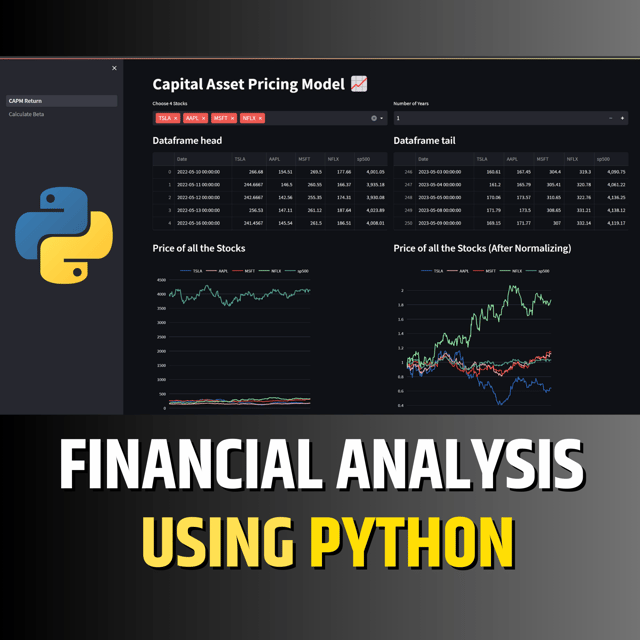
Financial Analysis (CAPM) Project using Python
Data Analysis Python Projects
Career Guidance
Career Guidance + Resume Review Package
Big Data Analytics (Handwritten notes)
About me
- Change the World With Your Time. Come and Join Us!https://topmate.io/join/ayushi_mishra

- My YT Channel Tech Classes (Projects + Tutorials + Career Tips)https://bit.ly/48MFgCf

Frequently asked questions
What is the best data science roadmap for beginners?
A solid beginner roadmap follows this order: Excel and SQL fundamentals, statistics basics (descriptive stats, probability, distributions), Python with pandas and NumPy, data cleaning and exploratory data analysis, visualization with Power BI, Tableau, or matplotlib, introductory machine learning, and finally 2–3 end-to-end portfolio projects. Most beginners need 6–9 months of consistent study to become job-ready. Following one structured sequence works far better than jumping between random tutorials.
Is there a free data science roadmap 2026 PDF I can download?
Yes, free roadmaps for 2026 are widely available as PDFs and Notion templates. Before downloading one, check that it is genuinely updated for current expectations — SQL, Python, statistics, machine learning basics, and GenAI tools for productivity — and that it gives you a clear learning order with checkpoints. A roadmap PDF is only useful if it tells you what to learn and in what sequence; otherwise, a simple written plan you build yourself works just as well.
How to become a data scientist in India?
The most common path is: build strong foundations in Python, statistics, and SQL, learn core machine learning concepts, then prove your skills with end-to-end projects. A technical degree helps with shortlists but is not mandatory — companies hire data scientists from engineering, math, economics, and even non-technical backgrounds when the portfolio is strong. Many people enter through data analyst roles first and transition into data science within 1–2 years.
What does the data analyst career path and salary look like in India?
A typical data analyst career path in India moves from data analyst to senior data analyst, then analytics manager or lead, and eventually head of analytics — or a switch into data science. Fresher roles commonly start around ₹4–8 LPA, mid-level analysts with 3–5 years of experience often earn ₹10–18 LPA, and senior or managerial roles can cross ₹20–25 LPA. Actual figures vary significantly by city, industry, and whether the company is a service or product firm.
Are there data analyst careers for freshers in India?
Yes, freshers are actively hired for data analyst roles in India, especially in IT services, BFSI, e-commerce, and analytics firms. What matters most at entry level is demonstrable skill — strong SQL, Excel, and Python, plus 2–3 portfolio projects and ideally an internship. Because competition is high, freshers who can show real dashboards and case studies with business insights stand out far more than candidates with certificates alone.
How to start a data analyst career from scratch?
Start with a fixed 6-month sequence instead of random learning: months 1–2 for Excel, SQL, and statistics fundamentals, months 3–4 for Python (pandas, visualization) and data cleaning, month 5 for 2–3 end-to-end projects, and month 6 for resume building and applications. If you are switching from another field, build projects around your own domain — the combination of domain knowledge plus analytics is a real advantage. Apply for internships and entry-level analyst roles from month 5 onwards instead of waiting to feel fully ready.
How to learn data analysis with Python?
The fastest way is to start working with pandas and NumPy on a real dataset within the first week, rather than completing long theory courses first. Spend 2–3 months practicing loading, cleaning, grouping, and visualizing data, then move to small analysis projects. Free public datasets, a structured learning sequence, and 1–2 hours of daily practice work far better than passively watching tutorials.
How to do data analysis using Python step by step?
A standard workflow looks like this: define the business question, load the data with pandas, clean it (handle missing values, duplicates, and wrong formats), perform exploratory analysis using grouping and summary statistics, visualize patterns with matplotlib or seaborn, and finish with written insights or recommendations. Skipping the cleaning step is the most common beginner mistake — real datasets are messy, and most of the actual work happens there.
Which data analysis Python projects should I add to my resume as a fresher?
Choose projects that show a complete workflow — data cleaning, analysis, visualization, and a clear business recommendation. Strong options include a sales dashboard with revenue insights, a user engagement analysis, a hotel booking analysis combining SQL and Python, a time series forecast for stock or sales data, and a supply chain or vendor performance analysis. Two or three well-documented projects with clear problem statements beat ten half-finished notebooks.
Which data analysis Python libraries should I learn first?
Start with pandas and NumPy, since almost every data analysis task in Python depends on them. Add matplotlib and seaborn next for visualization, ideally learning them alongside pandas rather than after. Hold off on scikit-learn, PySpark, or advanced libraries until your core pandas and visualization skills are solid — trying to learn too many libraries at once is a common reason beginners stall.
What is better for data analysis: Python or R?
For most learners in India, Python is the better first choice because it dominates job listings, works across data analysis, machine learning, and automation, and is easier to pick up. R is excellent for deep statistical work, academic research, and fields like biostatistics or economics research. Choose Python if your goal is industry jobs, and R if your target role is statistics-heavy research — attempting both simultaneously slows down progress on each.
Do I need a paid data analysis Python course to get a data analyst job?
No, a paid course is not mandatory — many analysts are self-taught using free resources plus consistent project work. What a structured data analysis Python course or mentorship really provides is sequencing, accountability, and feedback on your code, which helps if you struggle with consistency. Employers evaluate what you can demonstrate through SQL tests, take-home assignments, and portfolio projects, so any course is worth it only if it pushes you to build and finish real projects.