Testimonials
Services
Free Discovery Call: Data Analytics Consultancy
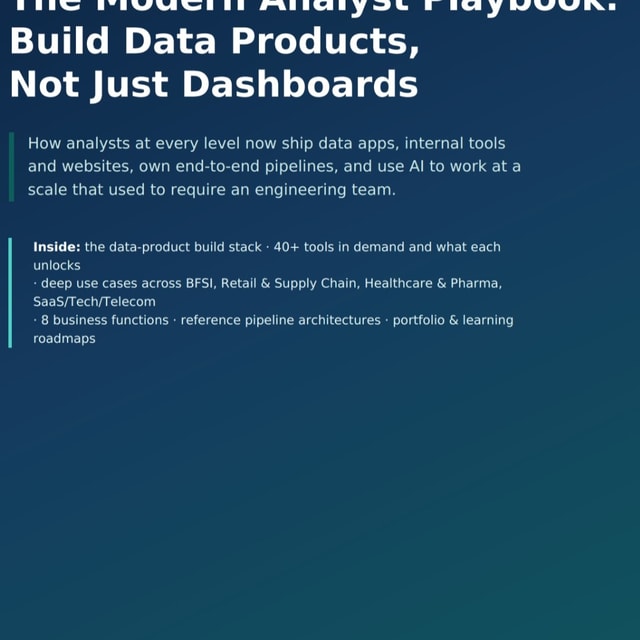
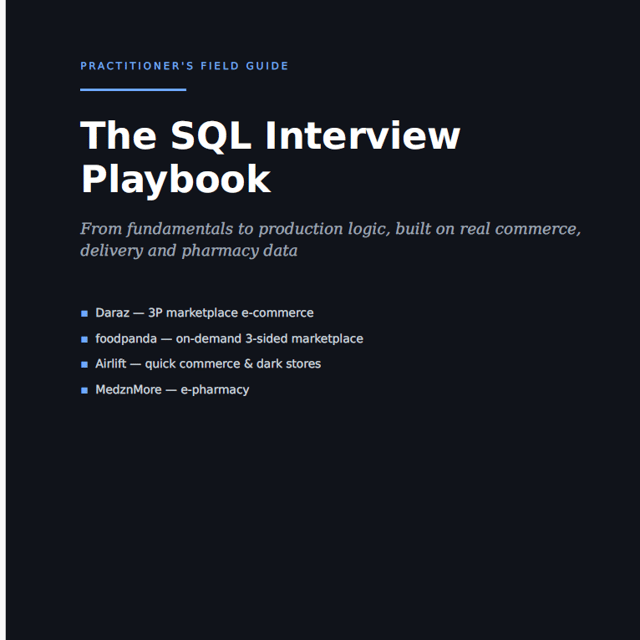
Career Mentorship | Data Analytics & Supply Chain
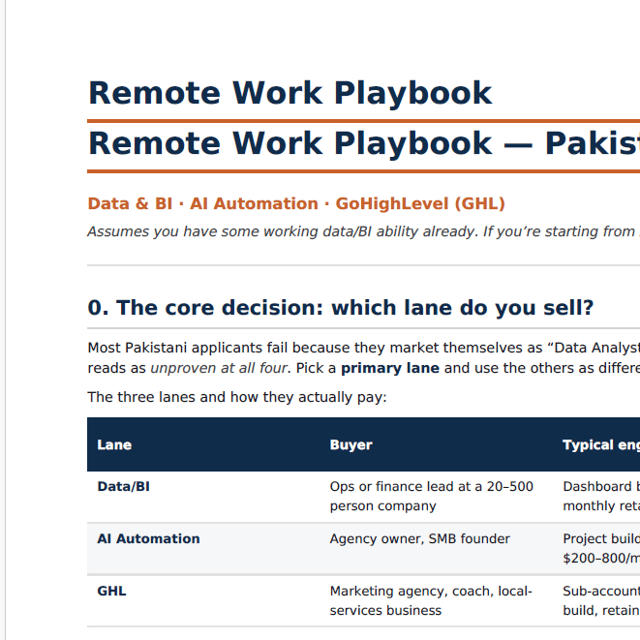
End to End Data Analytics Case Study
About me
- Zain is lauded for his expertise in data analytics and professional career counseling, offering actionable, personalized guidance.
 AI-generated based on testimonials
Frequently asked questions
What is data analytics and business intelligence?
Data analytics is the process of examining raw data to find patterns, trends, and answers to business questions, while business intelligence (BI) focuses on turning that data into dashboards and reports that support decision-making. The two fields overlap heavily and rely on the same core tools, such as Excel, SQL, Python, and Power BI. In simple terms, analytics explains why something happened, and BI keeps track of what is happening right now.
How does data analytics work?
Data analytics works in a cycle: data is first collected from different sources, then cleaned and organized, then analyzed using tools like SQL, Excel, or Python, and finally presented through visualizations and dashboards so decision-makers can act on it. A data analyst's real job is converting raw numbers into insights — for example, identifying why sales dropped in one region — so the business can respond with a data-backed strategy.
How to learn data analytics with no technical background?
You do not need a technical degree to enter this field. Start with Excel or Google Sheets to build logic, then move to SQL, and after that pick up Power BI and Python. A smart approach is to begin with free data analytics courses to understand the fundamentals before investing in any paid program, and to build small projects or case studies along the way that you can show in interviews. People from business, engineering, and completely non-technical backgrounds successfully transition into analytics this way.
What is the data analytics scope in Pakistan?
The data analytics scope in Pakistan is expanding quickly, with demand coming from banks, fintech, telecom, e-commerce, and software houses, along with a growing number of remote roles offered by international companies. Entry-level positions are competitive, but candidates with strong SQL, Excel, and Power BI skills plus a project portfolio stand out. Many analysts in Pakistan also increase their earnings significantly by working remotely for US, UK, and Gulf-based companies.
Are paid data analytics courses in Pakistan worth it?
They can be, but only if the course is practical — covering SQL, Excel, Python, and Power BI with real datasets, projects, and case studies instead of just theory. Before paying for anything, explore free resources to master the fundamentals, then choose a paid program only if you need structure, mentorship, or guided portfolio work. Employers in this field care far more about what you can build than about certificates.
Can I get data analytics jobs in Pakistan without experience?
Yes, fresh graduates do land data analytics jobs in Pakistan every year, but you need to replace experience with proof of skill. Build two or three portfolio projects, complete an internship if possible, and prepare a project-focused CV along with an optimized LinkedIn profile. Recruiters hiring for junior analyst roles look for demonstrated SQL and Excel ability and a clear understanding of the analysis process, not years of experience.
How do I get a data analytics internship as a student?
Learn Excel and basic SQL first, complete one or two small analysis or dashboard projects, and then apply through LinkedIn, university career portals, and company websites. For a data analytics internship, a short CV that highlights your projects matters more than grades, and even a four to six week internship dramatically improves your chances of converting into a full-time analyst role later.
Can I learn SQL for free?
Yes, you can absolutely learn SQL for free using online tutorials, documentation, and browser-based practice terminals where you write real queries without installing anything. SQL is one of the few job skills where free practice can genuinely take you to a job-ready level — the key is writing queries daily instead of only watching videos or reading theory.
How do I learn SQL from scratch?
To learn SQL from scratch, start with basic SELECT statements, then progress to filtering with WHERE, joins, GROUP BY, and subqueries, practicing each concept on a live SQL terminal as you go. With consistent daily practice, most beginners become comfortable with core SQL in three to four weeks, which is exactly why SQL is recommended as the first skill for anyone targeting a data analyst role.
What is easier to learn, SQL or Python?
For most beginners, SQL is easier to learn because its syntax reads almost like plain English and it does one specific job — querying data. Python is more powerful and flexible, but it is a full programming language with a steeper learning curve. If your goal is data analysis, the practical path is to learn SQL first and add Python later for automation, statistics, and handling larger datasets.
Should I learn SQL for data analysis before Python?
Yes — if you want to become a data analyst, learn SQL for data analysis first, because nearly every analyst role uses it daily for extracting, filtering, and joining data from databases. Python becomes valuable afterwards for cleaning bigger datasets, automation, and statistical work, but SQL is the core skill that interviewers test first and the one you cannot skip.
What is Power BI used for?
Power BI is used to connect data from multiple sources — Excel files, databases, and cloud services — and convert it into interactive dashboards and reports. Companies use it to monitor sales, KPIs, and performance in real time, while analysts use it to present insights to non-technical stakeholders in a visual, easy-to-understand format instead of raw tables.
What is a Power BI dashboard?
A Power BI dashboard is a single-page visual summary that combines charts, KPIs, and cards from one or more reports so decision-makers can see the health of the business at a glance. Unlike a multi-page report, a dashboard is designed for quick monitoring — for example, tracking monthly sales, orders, and targets together on one screen.
What is a Power BI course, and do I need one to get a job?
A Power BI course teaches you how to import and clean data, build data models, write DAX measures, and design dashboards and reports. You can self-learn Power BI through free content, but a structured course speeds up the process and gives you guided projects — and those projects matter most, because employers hiring analysts care about the dashboards you can actually build, not just the tools you list on your CV.