Testimonials
Services
50 Data Analytics Projects
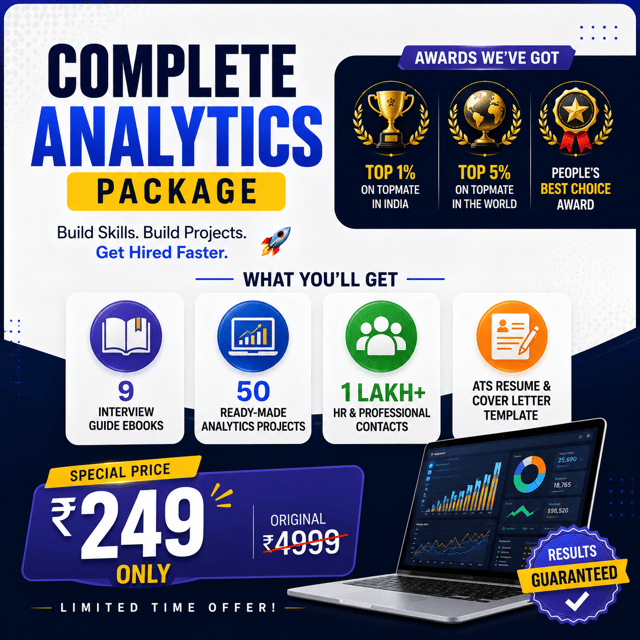

1 Lakh+ HR Details + ATS Resume + Cover Letter

Complete Interview Guide- 9eBooks
About me
- Rajat Saxena provides valuable resources and mentorship, greatly enhancing career growth and learning experiences for bookers.
 AI-generated based on testimonials
Frequently asked questions
How to learn data analytics from scratch?
Start with Excel and SQL, since most entry-level roles in India test these first, then move to Power BI or Tableau for visualization and Python for automation and deeper analysis. Learn basic statistics alongside, and apply every concept to a small dataset — sales data, expense tracking, or a public dataset. Free resources can build your fundamentals, but structured practice projects and mentorship speed up progress. Aim for 3–4 portfolio projects instead of only certificates, because recruiters shortlist on proof of work.
What is data analytics and data science, and how are they different?
Data analytics focuses on examining existing data to answer business questions — building dashboards, MIS reports, and trend insights that guide decisions. Data science goes further into machine learning, predictive modeling, and building algorithms, which needs stronger coding and math. Analytics roles are the easier entry point for freshers, while data science usually demands deeper technical skills. Many analysts transition into data science after 2–3 years of experience.
How does data analytics work in a real company?
It follows a simple loop: a business question is raised (why did sales dip in one region?), relevant data is pulled from databases, cleaned and organized, analyzed using SQL, Excel, or Python, and finally presented through dashboards and reports that leaders act on. This end-to-end flow is what's known as the data analytics life cycle — defining the problem, collecting data, cleaning, analyzing, visualizing, and deciding. Analysts sit between raw data and business teams, translating numbers into actions.
What is a data analytics job really like?
A typical day involves writing SQL queries, cleaning messy data, updating dashboards in Power BI or Tableau, preparing MIS reports, and discussing findings with marketing, finance, or product teams. It is a mix of hands-on technical work and communication with non-technical stakeholders. Such roles exist across banking, e-commerce, IT services, consulting, and product companies, with common entry titles like Data Analyst, Business Analyst, MIS Executive, and Reporting Analyst.
Which data analytics courses are actually worth paying for?
Judge any course on four things: does it teach SQL, Excel, Python, and Power BI hands-on; does it include real datasets and projects you can show recruiters; is there doubt-solving or mentor support; and does it help with interview preparation. Free tutorials and documentation cover theory well, so paid options only make sense when they add structured projects, feedback, and portfolio or placement guidance. Certificates alone rarely crack interviews — projects and practice do.
How can freshers get data analytics jobs without any experience?
Build proof of skill instead of waiting for experience: create 3–5 portfolio projects on real or public datasets, host them on GitHub or a portfolio link, and list them on a one-page ATS-friendly resume. Then optimize your LinkedIn and Naukri profiles with the right keywords, apply off-campus consistently, and seek alumni or community referrals, which convert far better than cold applications. Short-term internships, freelance work, and volunteer analytics projects all count as experience too.
How do I get a data analytics internship as a fresher?
Start applying on Internshala, LinkedIn, and company career pages early in your learning journey — you don't need to finish an entire syllabus first. Applications convert much better when your profile already shows at least one dashboard or SQL project, so build something small before applying. During the internship, focus on SQL, reporting, and dashboard tasks, because even a two-month stint can convert into a full-time offer or become a strong resume point.
How to do predictive analytics as a data analyst?
Predictive analytics uses historical data to forecast what is likely to happen next — churn, sales, or demand. The process is: define the business question, collect and clean historical data, explore patterns, choose a model (linear regression for numeric forecasts, classification for yes/no outcomes, time-series for trends), test accuracy on unseen data, then deploy and monitor it. Python libraries like pandas and scikit-learn handle most of this, and Excel offers basic forecasting for simple cases. Analysts who add forecasting to their dashboards become far more valuable because they answer not just what happened, but what will happen.
How to crack a data analyst interview as a fresher?
Most fresher interviews in India follow a pattern: a SQL round, an Excel or Python round, a case or guesstimate round, and HR. Prepare for each — practice SQL joins and aggregations daily, revise Excel functions and pivot tables, learn to explain your projects end to end, and rehearse a few guesstimates. Strong data analyst interview preparation is less about memorizing answers and more about completing several mock rounds and confidently walking through your portfolio.
What are the most common data analyst interview questions and answers for freshers?
Expect questions on SQL (joins, GROUP BY, WHERE vs HAVING), Excel (VLOOKUP, pivot tables), statistics (mean vs median, variance, outliers, correlation), basic Python or Power BI, and scenario questions like "sales dropped 20% — how would you investigate?" Prepare short, structured answers and always back them with a project example. Freshers who say "in my project, I did this" consistently outperform those who give only textbook definitions.
What are the common data analyst interview questions for 3 years of experience?
At this level, interviewers test depth over basics: complex SQL (window functions, CTEs, query optimization), data modeling, handling large datasets, dashboard design decisions, and the business impact of your past work. Be ready to discuss a project where your analysis changed a decision, how you handled messy data or tight deadlines, and how you managed stakeholders. Ownership and salary-negotiation questions also appear more frequently than technical trivia.
How to create a Power BI dashboard from scratch?
Connect your data source (Excel, CSV, or SQL database) in Power BI Desktop, clean it in Power Query, and set up relationships between tables. Add DAX measures for KPIs, then build visuals — cards for headline numbers, charts for trends, slicers for filters — and stick to one clean theme with limited colors. Finish with cross-filtering and a logical layout, keeping the most important insight at the top. The fastest way to learn is rebuilding a real sales or finance dashboard rather than following abstract tutorials.
What is a Power BI dashboard used for?
A Power BI dashboard gives decision-makers a single screen of live KPIs — sales, revenue, attrition, operations metrics — so they can track the health of the business without digging into raw reports. Freshers are often asked the difference between a Power BI dashboard and a report in interviews: a dashboard is a one-page, at-a-glance summary of key numbers, while a report is a multi-page, detailed, interactive analysis. Dashboards are built for monitoring; reports are built for exploration.
How to publish a Power BI dashboard?
Build everything in Power BI Desktop first, then click Publish and sign in with your Power BI account — the free license lets you publish to your own workspace. From the Power BI Service, you can pin visuals to a dashboard so they stay synced with your report. Sharing with colleagues or setting up organizational data refreshes generally requires a Pro license, so check your company's setup if the dashboard is for official use.
Where can I find Power BI dashboard templates for practice?
Power BI offers free sample datasets and downloadable reports within the tool, and large community galleries share ready-made PBIX files across sales, HR, finance, and e-commerce themes. Don't just open a template — rebuild it from the raw data, change the KPIs, and add your own visuals so you actually learn. Turning a template into a complete Power BI dashboard project for your portfolio is what impresses recruiters, because it proves you can go from raw data to a working dashboard.