Testimonials
Services






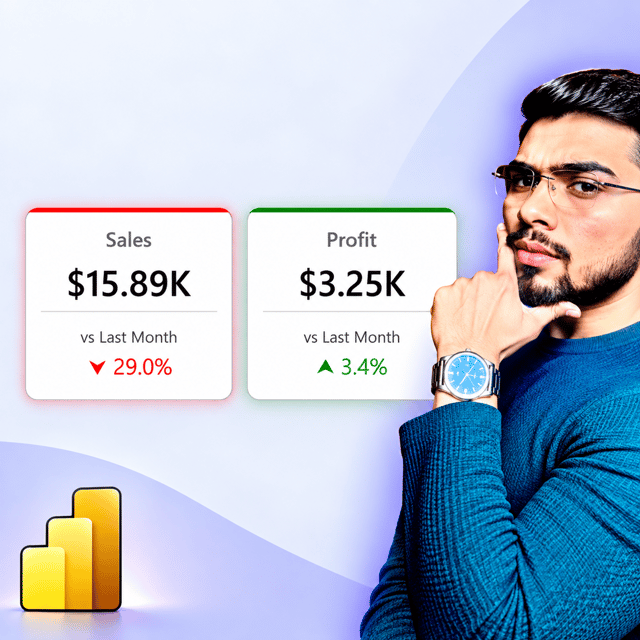




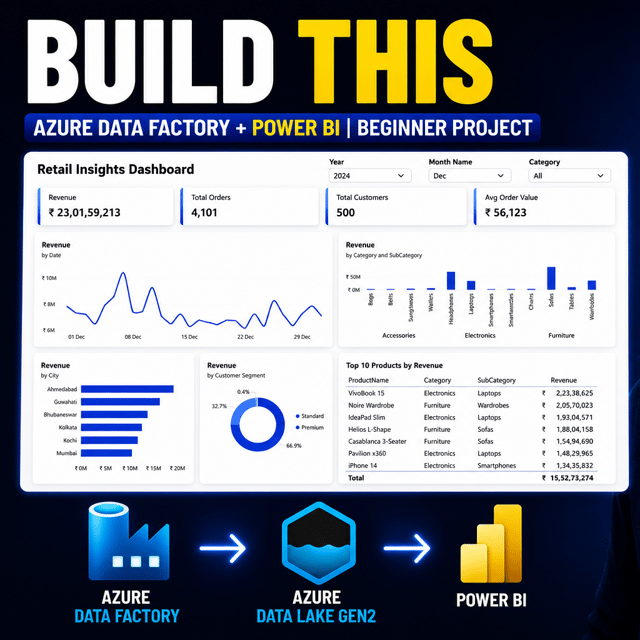

1:1 Mentorship on Power BI Issue (30 min)
Get Report & Dataset count in PBI Workspace

KPI Card with One Native Visual






Gradient BG SVG KPI Card


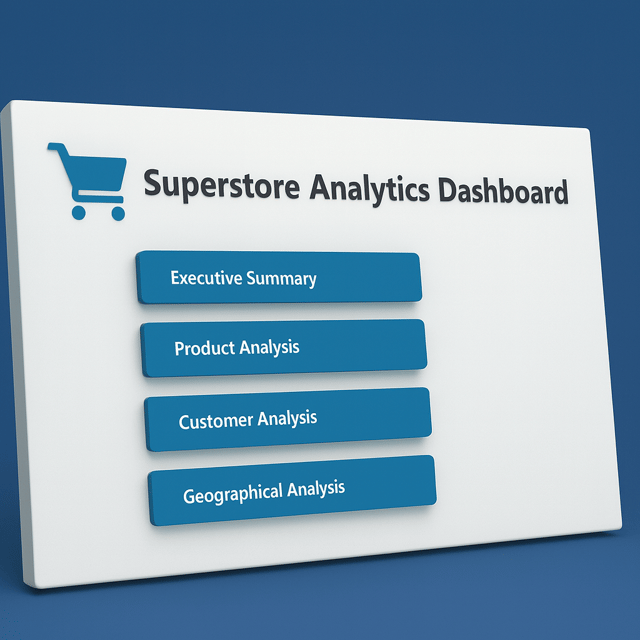
Superstore Analytics Dashboard
1:1 Mentorship on Power BI Issue (60 min)
About me
- BI Tricks - YouTubehttps://www.youtube.com/@bitricks

Frequently asked questions
What is Power BI DAX used for?
DAX (Data Analysis Expressions) is the calculation language of Power BI. It is used to create measures and calculated columns that turn raw tables into business metrics — totals, percentages, running totals, year-over-year growth, and KPIs. Whenever a visual needs a calculation that simple drag-and-drop aggregation cannot do, such as profit margin % or sales vs last year, you need DAX.
How to learn Power BI DAX?
Start with the two core concepts — filter context and row context — then learn the essential functions like CALCULATE, SUMX, FILTER, DIVIDE, and time-intelligence functions through a structured tutorial series. Practice daily on small, real datasets instead of memorizing syntax. If a formula keeps returning confusing results and you cannot see why, a short 1:1 session with an experienced Power BI mentor can fix in minutes what might take days alone.
Which Power BI DAX functions should I learn first?
Begin with CALCULATE, since almost every real-world measure depends on it, then move to SUM/SUMX, AVERAGEX, FILTER, RELATED, DIVIDE, IF/SWITCH, and time intelligence like TOTALYTD and SAMEPERIODLASTYEAR. You do not need to memorize a long list of Power BI DAX functions — most production reports are built from roughly ten to fifteen well-understood functions.
How do I practice Power BI DAX?
Take free datasets like Superstore or pizza sales data and rebuild real business measures: total sales, profit margin %, month-to-date sales, and top-N products. Write each calculation as both a calculated column and a measure to feel how context changes results. Consistent Power BI DAX practice with feedback — for example, getting your measures reviewed by someone experienced — is what turns tutorial knowledge into job-ready skill.
What Power BI DAX interview questions are commonly asked?
The most frequently asked ones are: explain filter context vs row context, what CALCULATE does, calculated column vs measure, SUM vs SUMX, handling many-to-many relationships, and the use of ALL/REMOVEFILTERS. Interviewers often ask you to write a measure on the spot, so practice writing formulas rather than only reading them.
What is data modeling in Power BI?
It is the way you structure tables and relationships before building visuals: fact tables connected to dimension tables (products, dates, customers) in a star schema, with correct cardinality and filter direction. Good data modeling in Power BI is the reason reports stay accurate and fast, while weak modeling causes duplicate rows, wrong totals, and slow files — problems that become much harder to fix once dozens of DAX measures depend on them.
Are data modeling interview questions asked in Power BI interviews?
Yes, very frequently. Expect star schema vs snowflake, fact vs dimension tables, relationship cardinality, single vs bidirectional cross-filtering, handling many-to-many with bridge tables, and why a measure returns unexpected totals. Pair these with Power BI DAX interview questions and you will cover what most interviewers test for data analyst and Power BI developer roles.
How to create a Power BI dashboard?
The typical flow: connect to your data (Excel, SQL, or other sources), clean and shape it in Power Query, build relationships between tables, write DAX measures for your KPIs, and then design the page — KPI cards at the top, trend charts in the middle, and slicers for filtering. Finally, publish it to the Power BI Service so others can view it. Sketching a one-page layout before building saves significant rework.
What are the best practices for Power BI dashboard design?
Keep the most important numbers visible without scrolling, use one consistent color palette where color actually carries meaning, align visuals on a grid, and give each page a single purpose instead of cramming in charts. Building the background layout in PowerPoint or Figma gives you precise control. Good Power BI dashboard design is measured by how quickly a manager can make a decision from the screen.
What is a Power BI dashboard and report?
A Power BI report is a multi-page file built in Power BI Desktop from a dataset, containing detailed interactive visuals. A dashboard, in the Power BI Service, is a single page that pins visuals from one or more reports for an at-a-glance view. In most workplaces, people say "dashboard" when they actually mean a report — the distinction mainly matters when you publish and share content.
Where can I find Power BI dashboard templates?
Start with Microsoft's built-in sample apps and sample .pbix files, then explore template galleries and .pbit files shared by Power BI creators. Ready-made files — such as a Superstore or retail sales dashboard you can download and open — are the fastest way to improve, because you can reverse-engineer the data model, DAX measures, and layout choices behind a polished report.
What are some good Power BI dashboard examples for practice?
Classic practice datasets include Superstore sales (sales, profit, region, shipping), pizza sales (time-based demand patterns), retail insights, HR attrition, and e-commerce orders. Pick one and build it end to end — cleaning, modeling, DAX, and design — then compare it with ready-made Power BI dashboard examples to spot gaps in your output. Three or four such projects make a strong portfolio.
Why is my Power BI report slow and how do I fix it?
Common causes: loading entire tables when only a few columns are needed, too many visuals on one page, bidirectional relationships, calculated columns where a measure would work, and unoptimized DAX iterators over large tables. Run Performance Analyzer to find the slowest visual, trim data at the source, and restructure the model into a star schema. If a business-critical report must be fixed by a deadline, a focused report review or 1:1 debugging session usually resolves in one call what would otherwise take days of guessing.
How do I start a career in Power BI?
Build skills in this order: Excel and SQL basics, then Power Query and data cleaning, then data modeling (star schema), then DAX, then visual design. Create three or four portfolio dashboards from public datasets, share them on LinkedIn or GitHub, and prepare specifically for DAX and data modeling questions, since those dominate Power BI developer and data analyst interviews in India. A career-guidance session with someone who works in Power BI daily can help you skip months of trial and error.