Testimonials
Services
Career Guidance
Discovery Call
About me
- One of the qualities I admire most about Sahir is his constant willingness to help. He always makes time to support others.Recommended by Manini Molehe on

- I can confidently say that he is one of the most brilliant minds I’ve encountered in this field. I highly recommend Sahir.Recommended by Marlon Alben on
- Sahir is an amazing problem solver, a natural innovator that executes at speed! He is an amazing mentor and coach!Recommended by Tihana De Beer on
- Sahir is excellent at what he does and is always willing to learn and grow. I would work with Sahir any day.Recommended by Leo van Wyk on
Frequently asked questions
What is the difference between a Power BI dashboard and a report?
A Power BI report is a multi-page, interactive document built in Power BI Desktop from a single semantic model, where you slice, filter, and drill into detail. A Power BI dashboard is a single-page canvas in the Power BI service made up of pinned tiles — often pulled from several different reports — designed for at-a-glance monitoring of headline KPIs. In practice: reports are for deep, interactive analysis; dashboards are for summarised, executive-style tracking.
How do I create Power BI dashboards?
Start with the report, not the dashboard: connect to your data in Power BI Desktop, clean and shape it, build your model with a few DAX measures, add visuals to report pages, publish to the Power BI service, then pin the most important visuals to a dashboard. Most people learn how to create Power BI dashboards this way, because every dashboard tile is sourced from a report — which is why getting comfortable with how to create Power BI reports is genuinely step one. Keep your first build simple: one page, five visuals, one clear question answered.
How to design a Power BI dashboard?
Design each page around one decision: key KPIs top-left, supporting detail below, and a maximum of five to seven visuals per page so nothing competes for attention. Lock in a limited colour palette and consistent fonts using a JSON theme file, use whitespace generously, and label everything clearly — a viewer should grasp the main takeaway in about five seconds. The quickest test: show the page to a colleague who has never seen the data and ask what stands out; if they hesitate, simplify.
Where can I find Power BI dashboard templates?
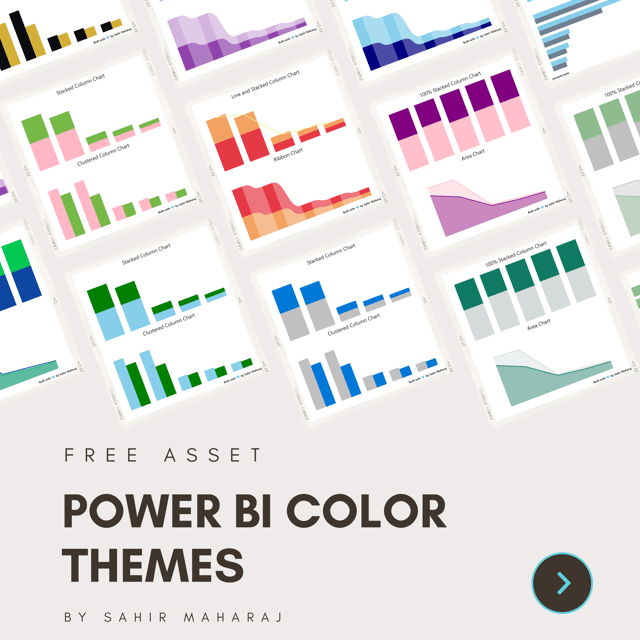
Microsoft's own template gallery and appSource are the best free starting points, and the Power BI community showcase is full of polished Power BI dashboard examples worth studying for layout and storytelling ideas. If you'd rather skip the design work entirely, curated packs like Sahir Maharaj's 100 Power BI Themes bundle — along with his finance, sales, and marketing templates — give you professionally built designs you can plug your own data into.
What is the PL-300 certification exam?
PL-300 is Microsoft's associate-level data analyst exam centred on Power BI. It measures four skill areas: preparing data, modelling data (including writing DAX), visualising and analysing data, and managing and securing Power BI assets. Passing it earns a Microsoft associate-level credential that employers widely recognise for data analyst and BI roles.
How to get the PL-300 certification?
Work through the official Microsoft Learn PL-300 learning path, practise hands-on in Power BI Desktop until modelling and DAX feel natural, take the free official practice assessment, then book the exam online with a proctor or at a test centre. Studying with a community also helps — practitioners who actively support PL-300 learners as moderators, such as Sahir Maharaj, can help you unstick the exact topics that slow most candidates down.
How to get the PL-300 certification for free?
Preparation can cost nothing: the full Microsoft Learn PL-300 learning path and the official practice assessment are free, and a paid PL-300 certification course is optional rather than essential if you pair free study with genuine hands-on practice. The exam itself always carries a fee, though discounted vouchers are sometimes available for students, Microsoft partner employees, and attendees of Microsoft events — check current offers before you book.
Is the PL-300 certification worth it?
For anyone targeting data analyst, BI developer, or analytics consultant roles, yes — recruiters treat it as a trusted skills filter, and it proves end-to-end Power BI capability rather than surface-level tool knowledge. The PL-300 certification salary benefit is real but not automatic: it shows up strongest when the credential is paired with a portfolio of dashboards and measurable business impact. If your work never touches Microsoft's data stack, a different certification would serve you better.
What is the PL-300 certification cost?
The exam fee is set per country and typically sits around the US$165 mark, so check Microsoft's exam pricing page for the current South African amount before booking. Factor in optional extras such as an Exam Replay retake voucher, practice tests, or structured training. Student pricing, employer sponsorship, and promotional vouchers can bring the out-of-pocket cost down significantly.
How long does it take to get the PL-300 certification?
If you already use Power BI at work, three to six weeks of focused study is a common runway; complete beginners usually need two to three months to build modelling and DAX foundations first. The exam itself is one sitting of roughly two hours including check-in, and you see your pass or fail result immediately. Candidates who miss narrowly typically clear it comfortably on a well-targeted second attempt.
How to renew the PL-300 certification?
Microsoft role-based certifications are valid for one year and renew free of charge: during the final six months before expiry, take the short online renewal assessment on Microsoft Learn, which covers the latest product updates. Pass it and your certification extends for another 12 months — no test centre and no fee. If you let it lapse, the full exam has to be retaken, so make sure your renewal reminder emails are switched on.
How to start a data science career?
Build in this order: Python or R plus SQL, core statistics, then three to five portfolio projects on real, messy datasets that end in a clear recommendation. Learn a BI tool such as Power BI alongside, since many entry-level roles blend analytics and data science, and publish your work on GitHub, LinkedIn, or Kaggle so hiring managers can see proof of skill. Structured mentorship shortens the path considerably — Sahir Maharaj, for example, has hosted more than 900 mentorship sessions for people breaking into the field.
Is data science a good career?
Yes — demand spans almost every industry, the data science career salary ranks among the strongest in tech, and the problem variety (forecasting, customer analytics, generative AI, optimisation) keeps the work interesting. The honest caveat is heavy competition at entry level: candidates with real projects and strong communication skills stand out, while certificates alone no longer cut it. If you enjoy problem-solving and explaining what the numbers mean, it's a strong long-term bet.
Is data science a safe career?
Safer than most knowledge work, but not static. AI already automates routine tasks like data cleaning and boilerplate code, which increases the value of people who frame the right problem, validate model outputs, and convert analysis into decisions — the parts automation handles poorly. The risk concentrates at the "routine tasks only" level, so continually adding skills such as generative AI, machine learning engineering, and deep domain knowledge is what keeps a data scientist secure.
What does a typical data science career path look like?
Most people enter as a data analyst or junior data scientist, move up to data scientist, then senior or lead data scientist, and branch from there into principal roles, head of data, or chief analytics and AI officer. Sideways moves into machine learning engineering, analytics engineering, and data product management are common and well paid. Data science career opportunities now span banking, insurance, retail, telecommunications, healthcare, and consulting — in South Africa, banks and large retailers are among the biggest employers of data talent.